About Protein Illumination Timeline

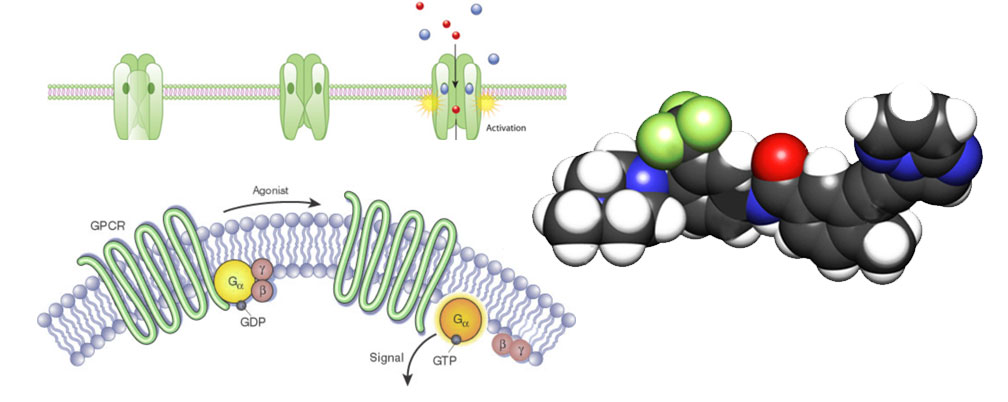
The Protein Illumination timeline describes the progress made in illuminating these dark proteins. The illumination is measured in terms of generated reagents and data associated with the understudied targets. On the topic of illuminating Ion Channels, there is one Ion Channel PIT table sharing the status of CDNA, CRISPR, Cells, Expression, Phenotype, Antibody, Proteomic, Activity, and mouse reagents. For GPCR illumination there are two PIT tables: GPCR Mice (guideRNA, Embryo injection, Germ-line transmission, Validation of expression, Anatomic survey, Detailed expression, Mouse available) and GPCR Probes (Physical screen confirmed actives, 3D model, Docking confirmed actives, Potency, Selectivity, Cellular activity, Inactive control, In vivo activity). For Kinase illumination there are two PIT tables: Kinase Chemical Tools (Broad screening, NanoBRET Tracer, NanoBRET Assay, Cell-active, Tool available) and Kinase Proteomics (PRM Peptides, PRM Curve, Cells, Expression, Protein interactions). These tables have live links to the resources based on metadata collection via the Resource Submission System (RSS) developed by the RDOC group at University of Miami, and implemented in the website interface on DruggableGenome.net by the RDOC group at University of New Mexico.
